Avoidable deaths have increased in the UK: the damning data political parties aren’t discussing

Avoidable deaths have increased in the UK: the damning data political parties aren’t discussing
Lucinda Hiam, University of Oxford; Danny Dorling, University of Oxford, and Martin McKee, London School of Hygiene & Tropical Medicine
One question that British voters may have asked themselves during the 2024 election campaign is whether they are any better off now than they were in 2010 when the Conservative-led coalition came to power. A recent poll reveals that most Britons (73%) think they are not.
This is unsurprising given the evidence. Average incomes have grown more slowly than previously, and economic growth has lagged behind many comparable nations. Public services have worsened. Now, along with falling life expectancy and rising child deaths, the Office for National Statistics (ONS) shows that another key measure of health has worsened: avoidable mortality.
The ONS data tracks trends at the level of local authorities in “preventable mortality”, which can be avoided through effective public health and “primary prevention” before a person becomes unwell, and in “treatable mortality”, avoidable through timely treatment once a person needs it.
When combined these two measures are termed “avoidable mortality” or “avoidable deaths”. All these measures consider only deaths in those aged under 75 and are age-standardised to enable fair comparisons, without being affected by the difference in age distributions, among local authorities and across time. While the data for England is reported by year, those for local authorities are averaged over three years to minimise the effect of short-term fluctuations, such as cold winters.
These latest statistics show sustained progress between 2000 and 2012, after which the rate of improvement slowed, before worsening from 2019 and during the pandemic. The most recent data show a slight recovery for England in 2022, but still worse than in 2019.
Avoidable, treatable and preventable deaths in England, 2001-2022
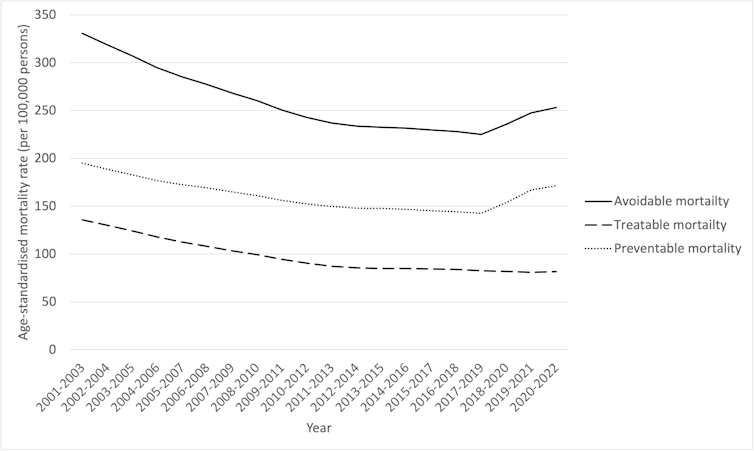
Office for National Statistics
These findings are not, in themselves, surprising. Since the early 2010s, the UK has vied with the US for bottom place in the league table for gains in life expectancy.
ONS data published in January 2024 showed that life expectancy had returned to 2010-12 levels for females and slightly lower than over a decade ago for males. While inequalities have widened since 2010, it is shocking to see some parts of England have fared even worse than was suspected at a time when others were improving.
Those places that have done well show what was possible. Richmond upon Thames, a prosperous area in south-west London, saw a 21% reduction in avoidable deaths between 2009-11 and 2020-22, with a similar reduction in Oxford (20%).
In contrast, Castle Point, on the Essex coast, saw a 22% increase in avoidable deaths, and Walsall in the West Midlands a 19% increase.
Almost half of all local authorities experienced an increase in avoidable deaths, with increases in the rate. Over the same period (2009 to 2022), England overall experienced an increase in avoidable deaths of 1% and Wales of 1.5%.
The gap between local authorities with the highest and lowest avoidable death rates has widened, from 2.8 times in 2009-11 (with Hart in Hampshire at 162 per 100,000 people compared with Manchester at 460) to 3.4 times (with Hart again lowest, at 133 per 100,000 people and Blackpool now worst, at 455).
This widening gap reflected a combination of large improvements in places where avoidable death was already low (18% lower in Hart) and worsening where it was high (8% higher in Blackpool). The few exceptions where avoidable deaths fell from high levels did so modestly (7.9% lower in Manchester, 6.1% lower in Rhonda, 3.8% lower in Newcastle).
In general, areas with worse health in 2009-11 did less well over the next 11 years.
Ignored by all parties
These measures getting worse in an advanced industrialised country should be cause for significant alarm. Yet this information does not seem to have been discussed during the general election campaign – by any party.
The political parties’ manifestos contained shopping lists of numbers of NHS appointments that will be offered or scanners bought. Detailed analyses of the state of the nation’s health – and the reasons for its deterioration – were absent.
We might contrast, with concern, the media attention that greets the quarterly announcements of the UK’s economic growth figures with the very limited coverage of this data.
What the latest data reveals is particularly damning given the “levelling up” agenda set out by Boris Johnson in 2019, when he was campaigning for the leadership of the Conservative party. An agenda that, a recent review concluded, “has been glacial – and, on many metrics, the UK as a whole has gone into reverse”.
These are several similar reports highlighting poor progress and reversal of previously improving trends. For example, the terrible state of child health, with the Royal Society for Public Health noting how the new data show that avoidable child deaths have been rising since 2020. In England, it was 8.1 deaths per 100,000 in 2020, but 9.6 per 100,000 children in 2022.
During the election campaign of June 2024, none of the major parties set out a plan that would reverse these worrying trends. While reducing NHS waiting lists is important, it misses the bigger picture. Why are more people needing the NHS?
As well as the lack of adequate funding and workforce support for the NHS, the factors that make people unhealthy have worsened, with food poverty, education and housing particular concerns.
Stemming the flow without turning the tap off is a short-term solution for a long-term problem that requires a serious strategy – especially when the situation is getting worse.![]()
Lucinda Hiam, DPhil Candidate, Geography and the Environment, University of Oxford; Danny Dorling, Halford Mackinder Professor of Geography, University of Oxford, and Martin McKee, Professor of European Public Health, London School of Hygiene & Tropical Medicine
This article is republished from The Conversation under a Creative Commons license. Read the original article.
For a PDF of this article and where it was originally published click here.